Redesigning Data Transparency for District Leaders
Enabling international expansion through better dashboard UX
My Role
Lead Product Designer
Product Manager
Timeline
Oct 2024 - Oct 2025
(one year)
Team
2 engineers, 1 product manager
Project Context
Knowledgehook developed an analytics dashboard for District and School Leaders to monitor student comprehension, performance, and engagement across math strands and learning goals. The dashboard displayed aggregated student data at multiple levels: district wide → school level → grade level → class drilldown → student drilldown.
In late 2024, Knowledgehook started looking to expand internationally into districts outside of Canada. During discussions with California district leaders, we learned our dashboard was missing critical features that other competitor platforms offered.
Without implementing these improvements, Knowledgehook risked losing out entirely on the California deal, failing to achieve a successful launch in a new market.
The Challenge
Knowledgehook is a start-up edtech that thrives in a small-team, fast-paced environment. The product team had limited resources to conduct user research and validate solutions.
Discussions with California surfaced 4 critical issues we needed to solve that were blocking adoption:
No data export capability. Districts needed to be able to download the data from our Dashboard for their own reporting and presentations, as well as for integration within their own data systems.
Limited navigation. Districts leaders didn't have the ability to drilldown further into school classes, or individual students. Users wanted to be able to see data at the student level, in order to have meaningful conversations with teachers about student proficiency.
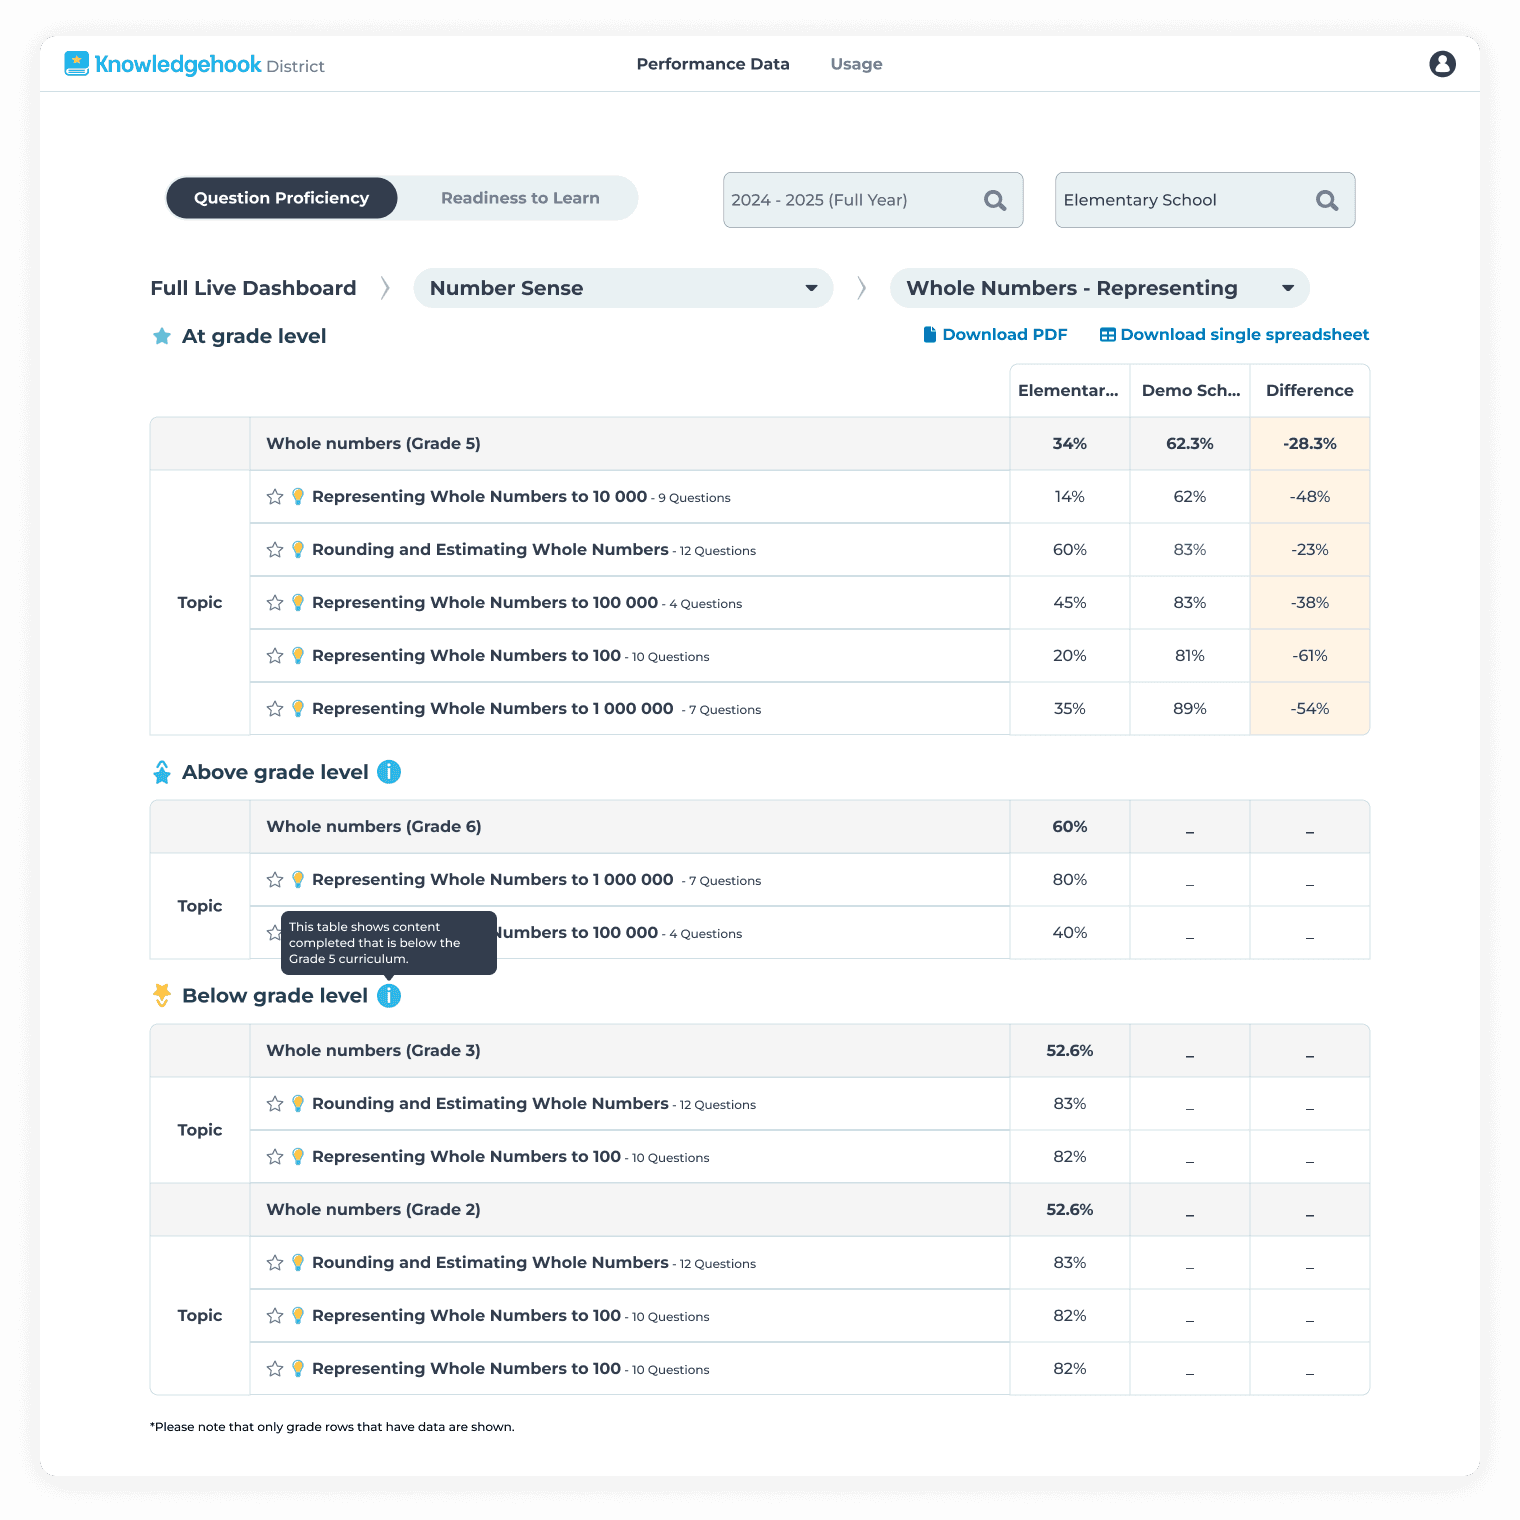
Unclear Data significance. Data considered insignificant was hidden behind a "-" in the table, creating confusion with other data cells that showed the same symbol for no data.
Data integrity problems. Students being assigned below-grade content questions were being shown at-grade level. This creates a false picture of at-grade level competency.
The Solution
My job was to enhance the dashboard by designing and shipping 4 solutions for each critical problem, validate them with users, and ship within tight timelines:
Enabled users to download data in a PDF or Excel format using clear text links in an intuitive layout.
Improved a multi-level, 3D drilldown system next by extending the text link pattern to table cells.
Clarified statistical insignificance by surfacing data and labelling it appropriately.
Separated out-of-grade performance by designing distinct tables with clear headers and informational tooltips.

Constraints & Tradeoffs
I worked directly with the CEO and VP of Product due to the critical nature of the expansion deal
The download feature needed to be designed and shipped as a P0 hotfix
The Out-of-grade data work had a hard deadline of October 2025
I validated solutions with the California district leaders and Ontario superintendents
I made design decisions within technical and timeline constraints
I prioritized which problems to solve and when based on business impact and engineering effort.
Impact
Secured California expansion - Features shipped in time to support adoption within Californian schools
Reduced volume of support tickets and feature requests
Improved data transparency, district leaders can feel confident they see the full picture in the data
The Approach
I conducted user interviews through:
California district leaders during partnership discussions
Account managers who worked daily with districts
Former superintendents now working as Knowledgehook consultants
Analysis of support tickets and feature requests
As well, this project had a fair few constraints:
The download feature needed to ship immediately as a P0 hotfix
The out-of-grade data work required significant backend engineering, with a hard deadline of October 2025
I had to work very closely with executives (CEO, VP of Product) due to the critical nature of this project
Timeline

Solution 1: Introduce data exporting
Districts needed to download data for Ministry presentations and their own analysis. I designed a dual format system: Download PDF for presentations, Download spreadsheet for excel data manipulation.

Key decisions:
Use native browser download dialogs instead of custom UI to reduce development time and maintain familiar UX
Create distinct naming conventions for different dashboard views (all grades / all strands vs. filtered views) so downloaded files were immediately identifiable
Design hover tooltips for each link to clarify what data was being exported
Place download text links prominently above each table for clear hierarchy and readability
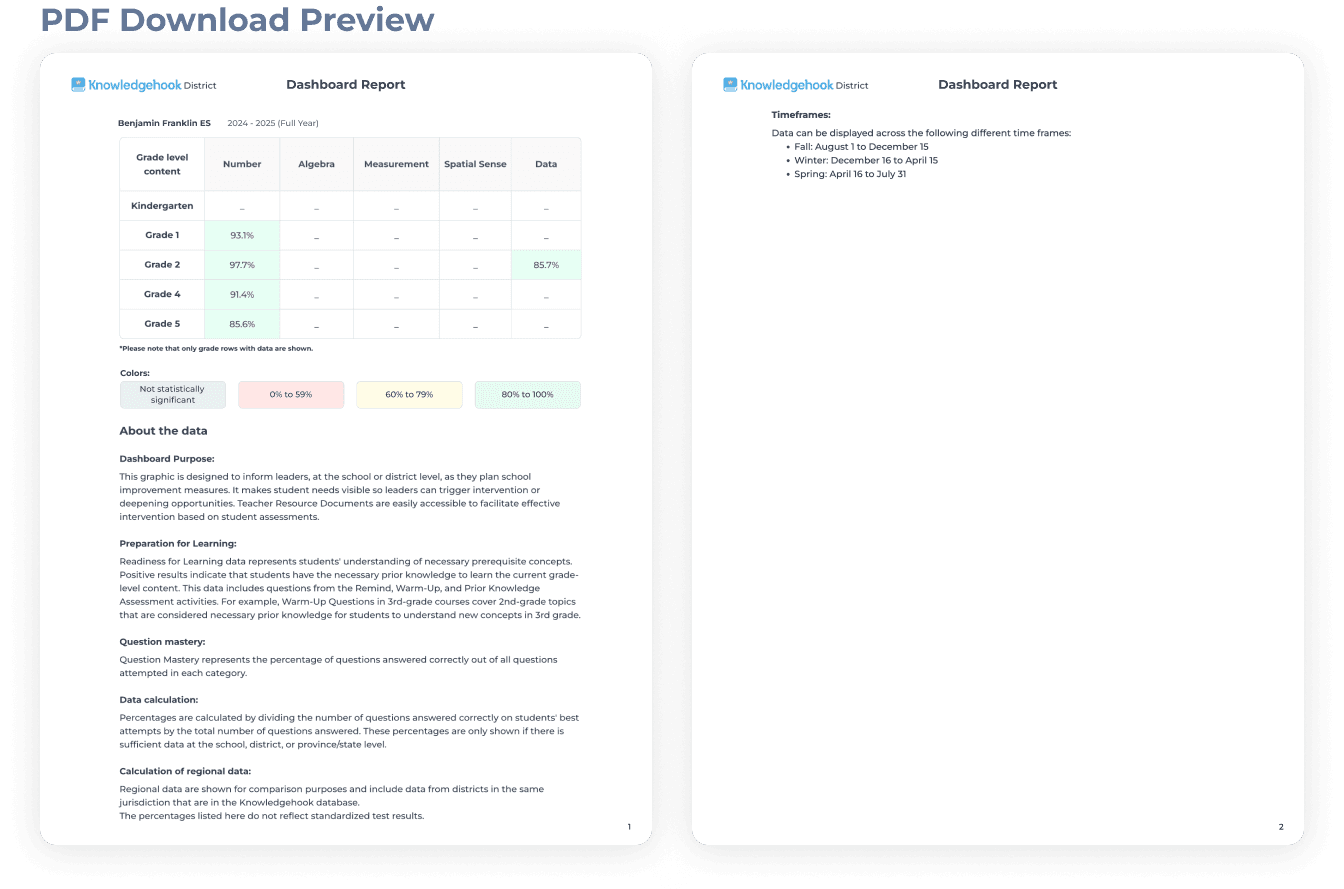
PDF mockup for presentation and information
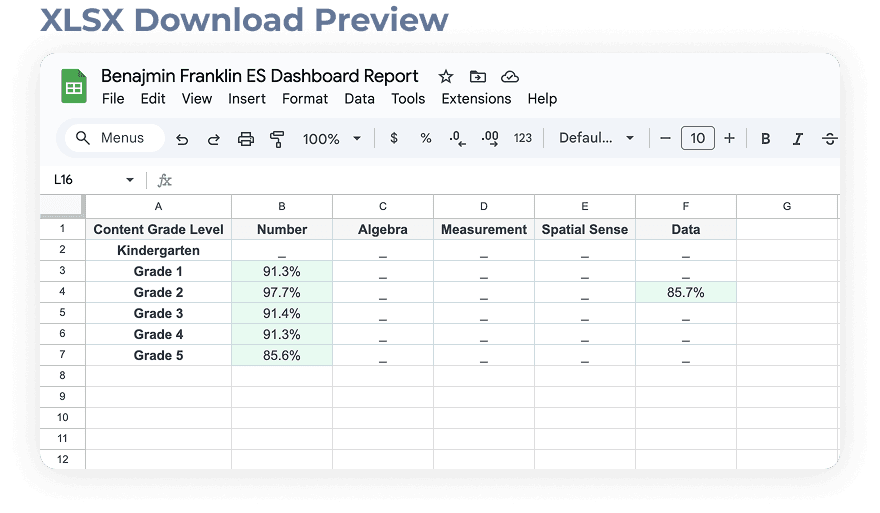
Excel mockup for data analysis
On top of providing specs for the download links, I also provided sample exports.
Why this mattered:
Districts could now integrate Knowledgehook data into their own existing workflows without manual requests to Knowledgehook Data Analysts.

Specs provided for PDF generation
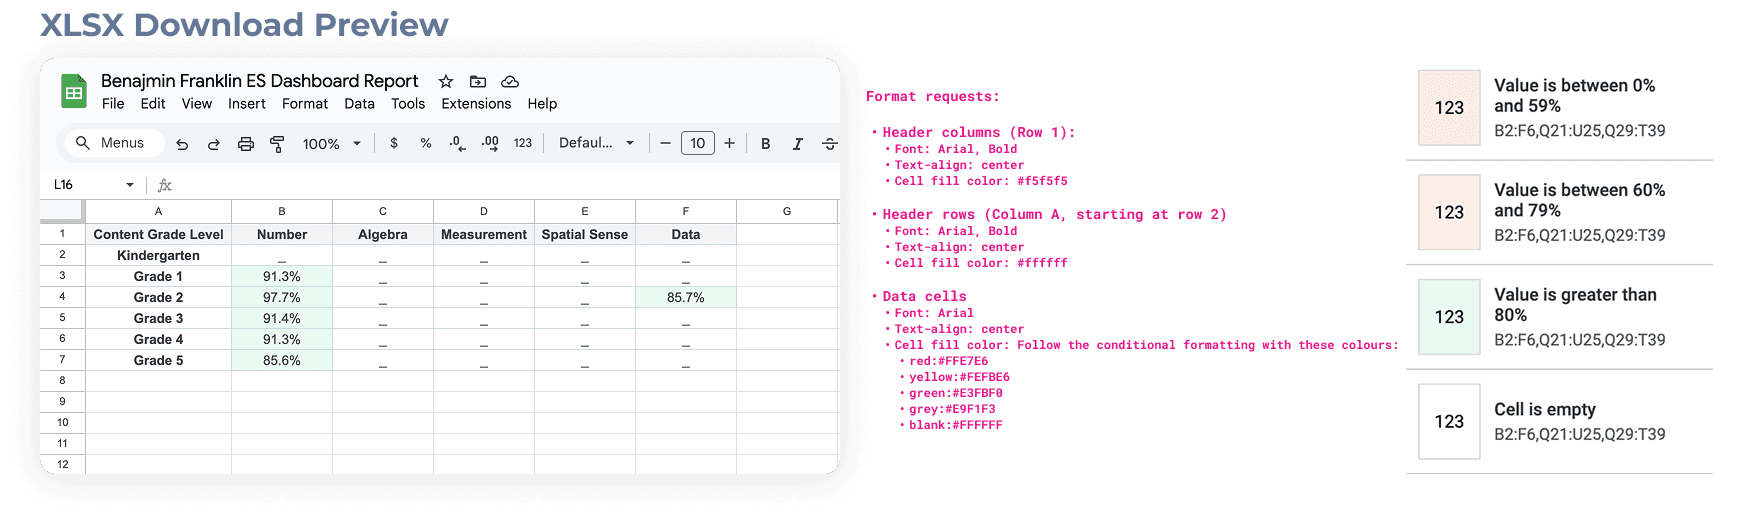
Specs provided for Excel generation
I worked directly with engineering to ensure they had all the information and redlines they needed to successfully implement this exporting functionality.
Solution 2: Improved drilldown navigation
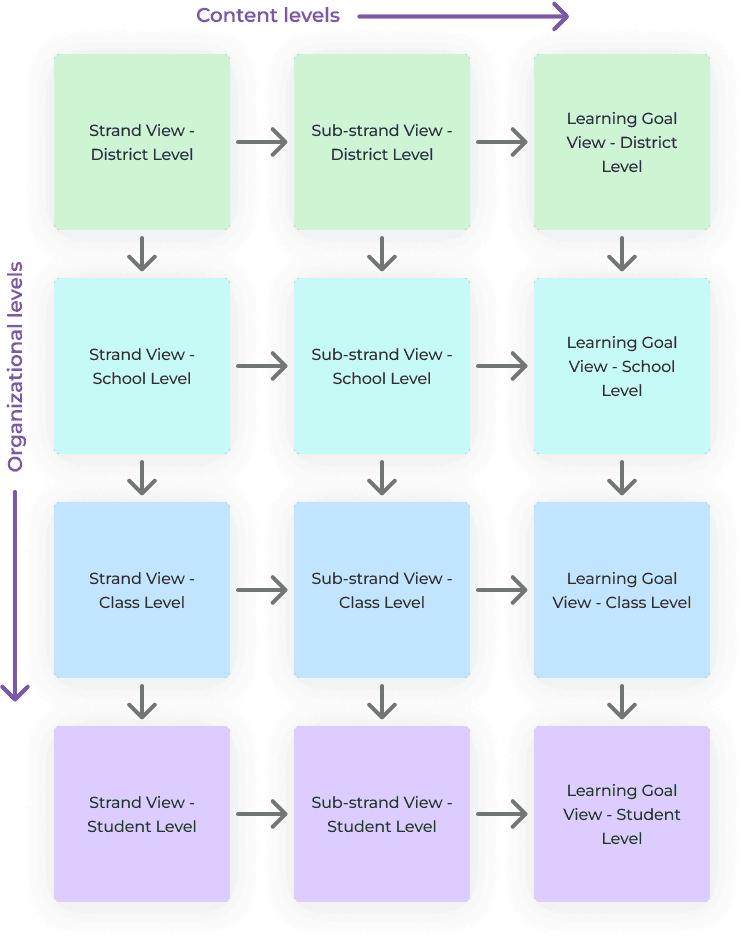
District leaders needed to navigate through a 3-dimensional data hierarchy: Organizational Levels (District → School → Class → Student) and Content Levels (Strand → Sub-strand → Learning Goal).
Users needed to navigate through any combination of these levels.
My design choices:
Made clickable cells obvious using link-style text formatting.
Utilized the top right table cell to help users identify which level they were viewing (Content Grade Level vs. Content Class Level).
Documented all navigation paths in a clear flowchart, using mockups to show engineers the exact navigation structure.
Ensuring navigation was appropriate across permissions (District leaders viewing the District Dashboard can filter by school, but Principals viewing the School Dashboard only see their school).
Drilldown by Organizational level (Grade/School → Class → Student): Change the table row information, not the table column information.

Drilldown by Organizational level (Grade/School → Class → Student) and Content Level (Strand → Sub-strand): Change both the table row information and table column information.

Drilldown by Organizational level (Class → Student) and Content Level (Sub-strand → Learning Goal): Change both the table row information and table column information.

I ensured the table cell links had a hover tooltip, carrying over pattern recognition with our reusable designs and maintaining consistency.
Clicking in each grade expands to display the classes within
Clicking in each class expands to display the student level data within
Solution 3: Surfacing statistically insignificant data
Previously, cells displayed a hyphen "-" for both 'no data' and 'not statistically significant' data. This forced users to have to drilldown to check if data existing.
Key decisions:
Show the actual percentage, even when the sample size is too small.
Grey out the cell to indicate 'not statistically significant', add a new label to the "Colors:" data legend.
Reserve "-"exclusively for 'no data'.
Why this worked:
Users could now instantly see which table cells actually had data, they could determine if the cell had significant enough data to drilldown further into, and they can make informed decisions about the actual performance data now surfaced.
Solution 4: Separating out-of-grade data
The most complex and impactful change to the dashboard.
The reality was that Grade 5 students showing 50% comprehension were actually at 30% for grade 5 content, because the other 20% was made up from grade 4 level content.
This was inflating performance metrics and not showing true, accurate data. District leaders couldn't see that students were struggling with at-grade level content, therefore they couldn't have meaningful conversations with principals and teachers about student learning outcomes and necessary interventions.
Before
Learning Goal level data showing all data collected from Grade 5 students, regardless of the grade level of the content

After
Learning Goal level data showing all data collected from Grade 5 students separated based on whether the content was from at, above, or below grade content
I tested multiple visual approaches, connecting with California district leaders and previous superintendents from Ontario to validate each solution and collaborate on the best approach for users before landing on separate tables. District leaders needed to quickly scan at-grade performance, then drilldown into out-of-grade data when needed.
Iteration 1: showing all table rows in a single table.

Iteration 2: trying to use numbers within an icon to signify out-of-grade content.


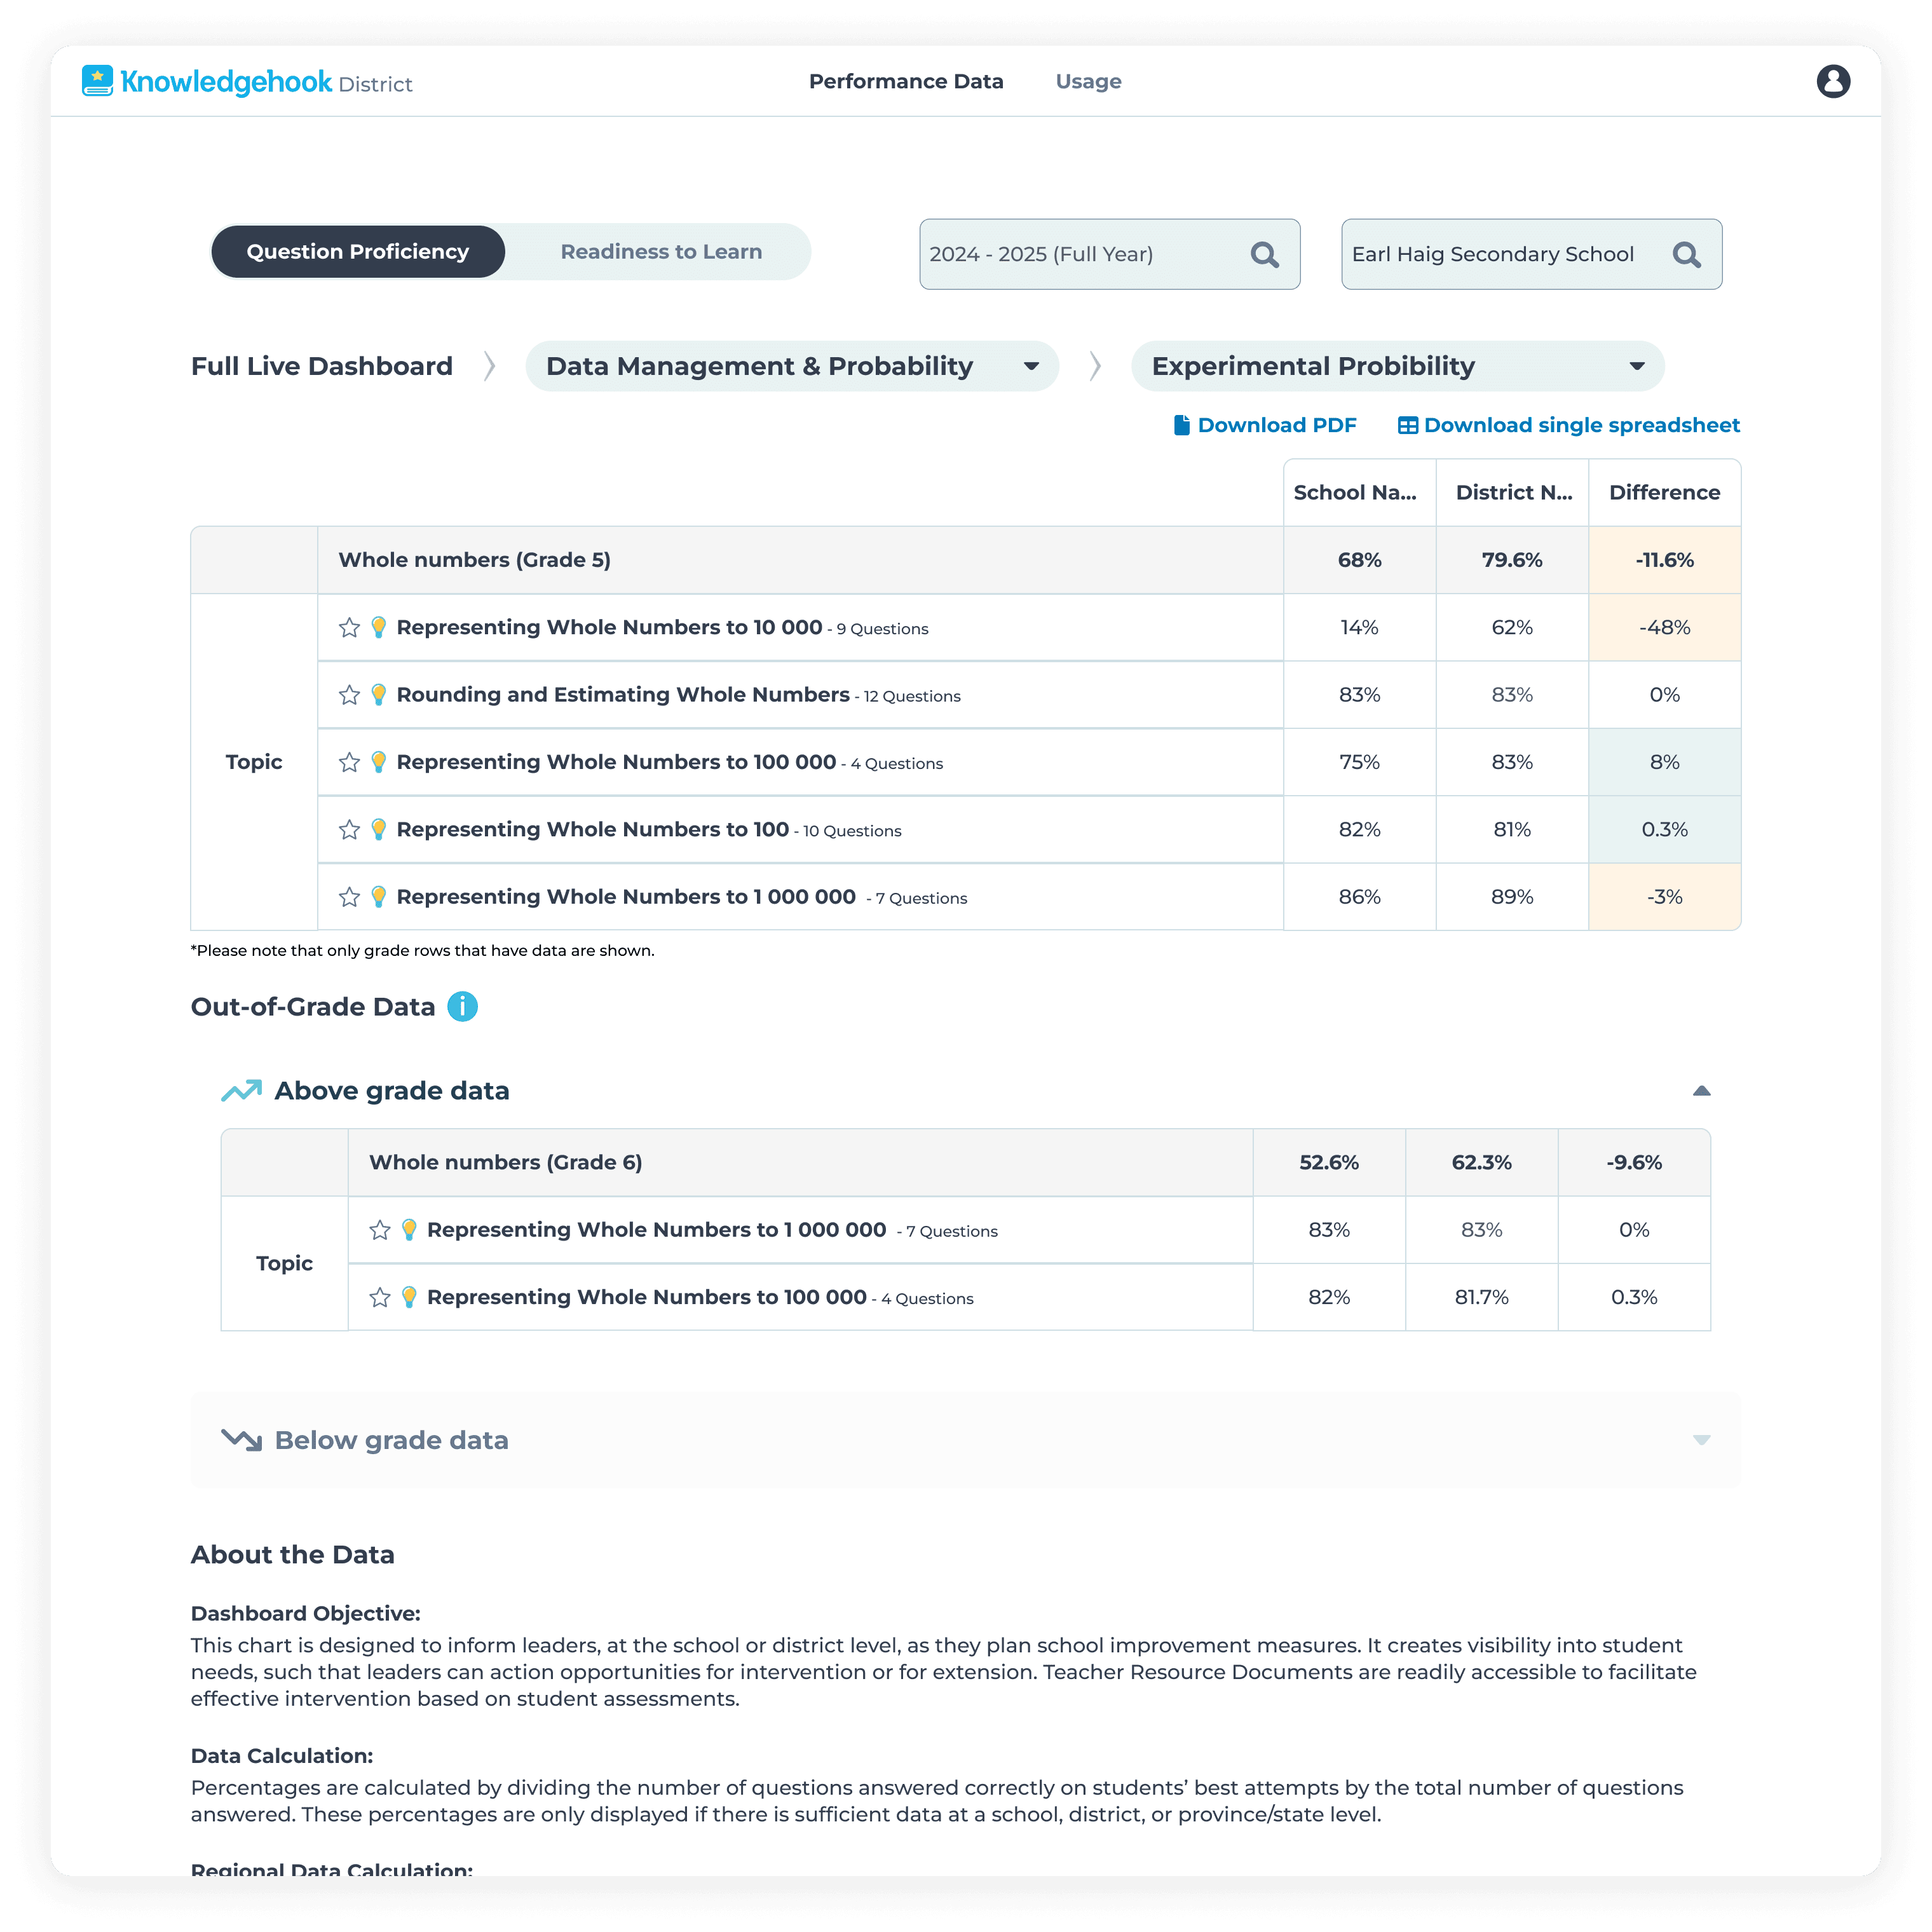
With feedback and considerations from district leaders and superintendents in mind, we proceeded with a version of Iteration 4, that showed all data up front instead of hiding it behind accordions and clicks.
From there, I continued to work with engineering, providing detailed redlines using our existing design and token system for a smooth and easy hand-off.
Edge cases I designed for:
What happens when no at-grade questions were answered?
How to show which grade level the out-of-grade data came from?

Impact
We shipped all requires features on time, and secured the deal with California.
All four features went live in phases between October 2024 and October 2025. The work enabled successful expansion into California, as well as improving overall user satisfaction by 37%, by reducing support requests and decreasing the amount of feature requests from users.
Reflection
What I learned
Separate tables reduced cognitive load better than mixed visual indicators
Frequent stakeholder feedback prevented major rework
Would add breadcrumb navigation in V2 to improve wayfinding


Contact me: aszczepanowski@outlook.com
Copyright © Amy Szczepanowski 2026